Gain Insight from Analytics
The Analytics page provides some necessary statistics and accountability measures to ensure that issues are progressed and resolved in a satisfactory manner.
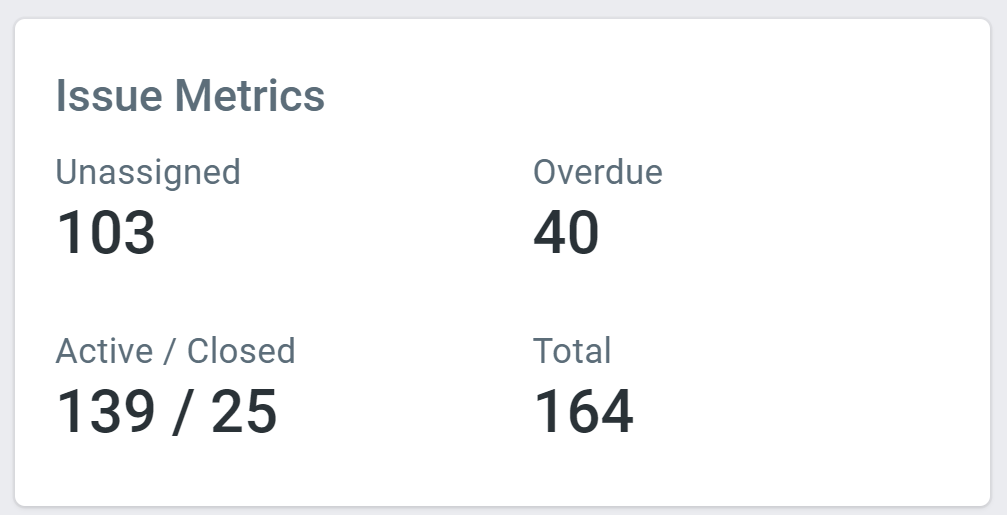
Issue Metrics
This shows the total number of issues and how many of them are unassigned, overdue, active, and closed.
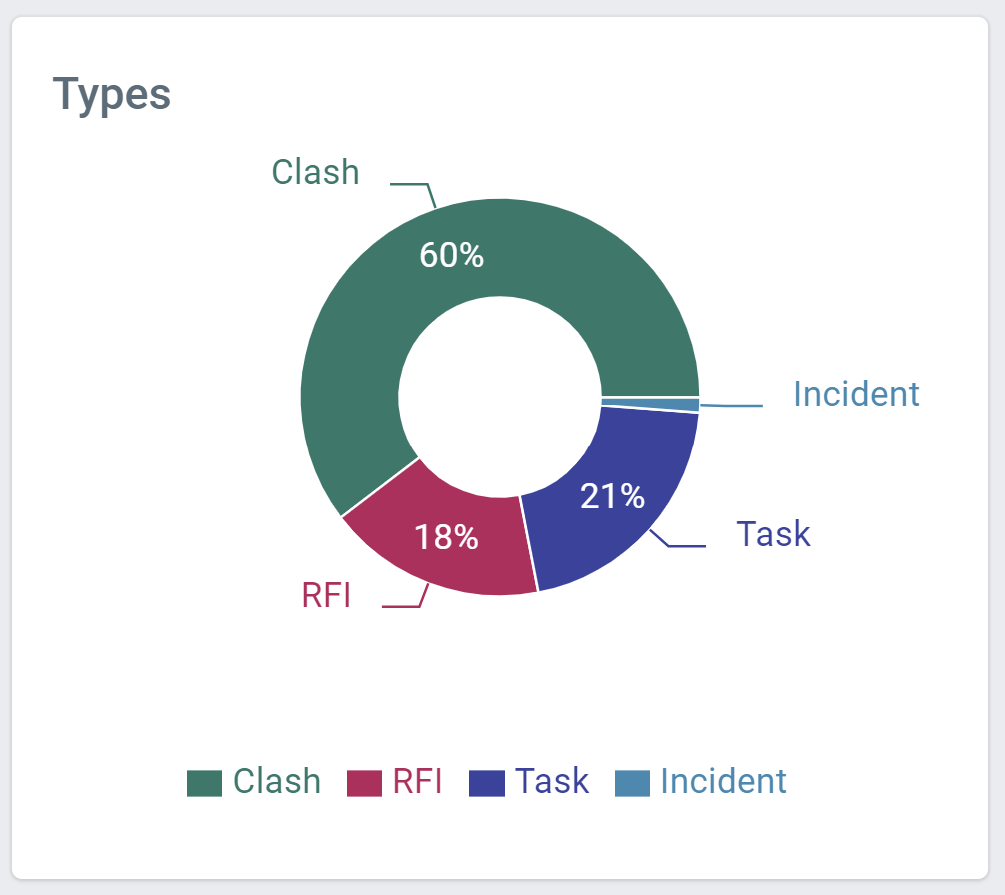
Issue Field Pie Charts
For every quantifiable issue field, there's a corresponding pie chart to show the percentage of every option.
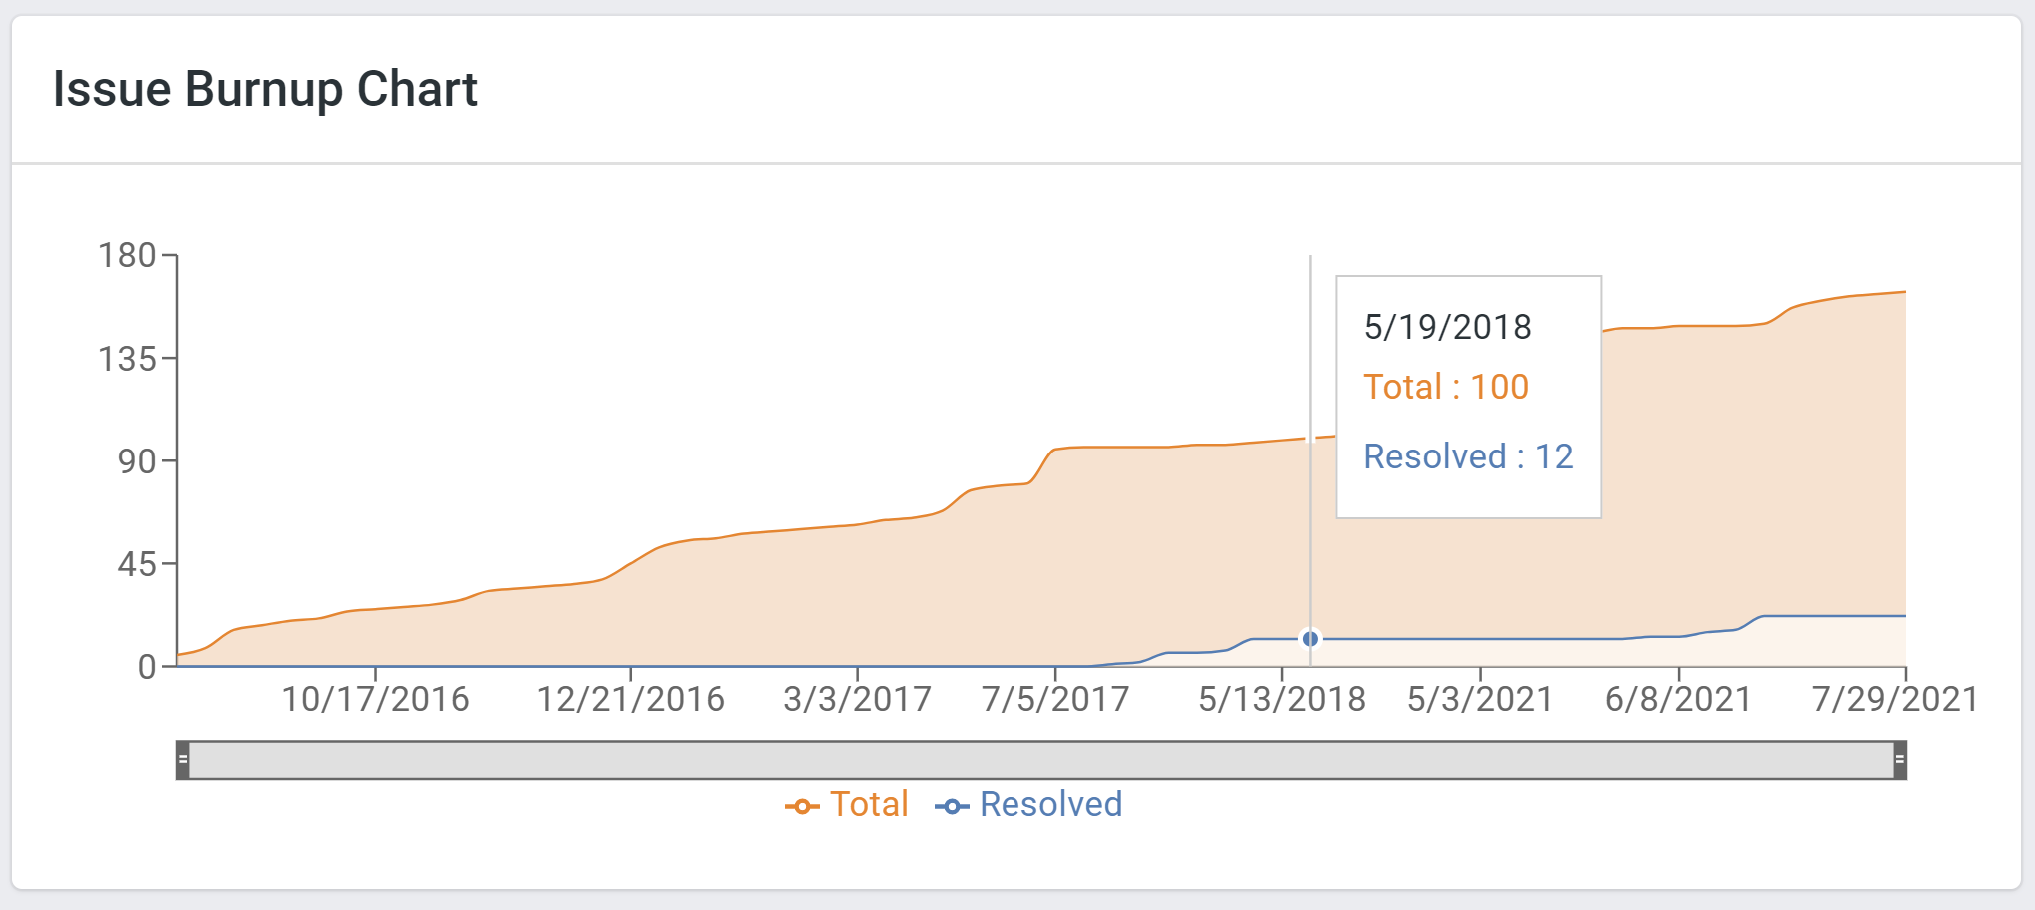
Issue Burnup Chart
A burnup chart is a tool used to track how many issues have been resolved (i.e. moved to the final status), and show the total number of issues in a channel.
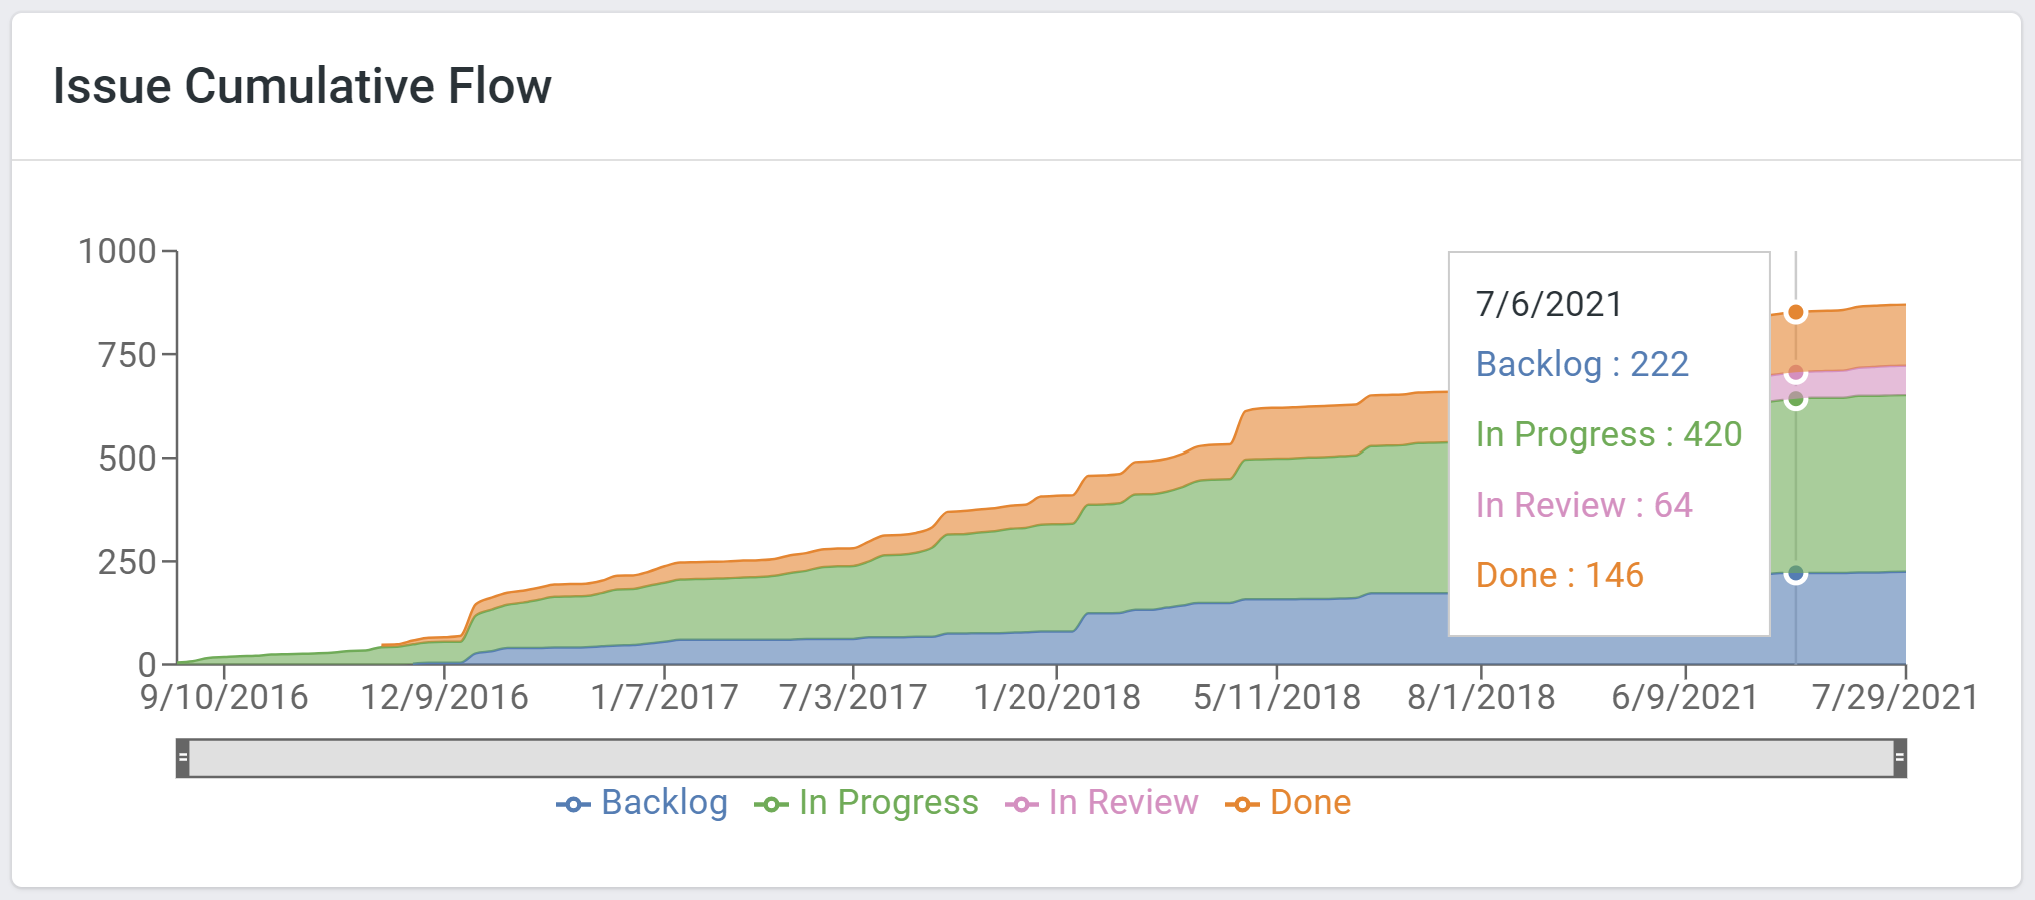
Issue Cumulative Flow
A cumulative flow is an area chart that shows the various issue statuses over time. Each coloured area of the chart equates to an issue status.
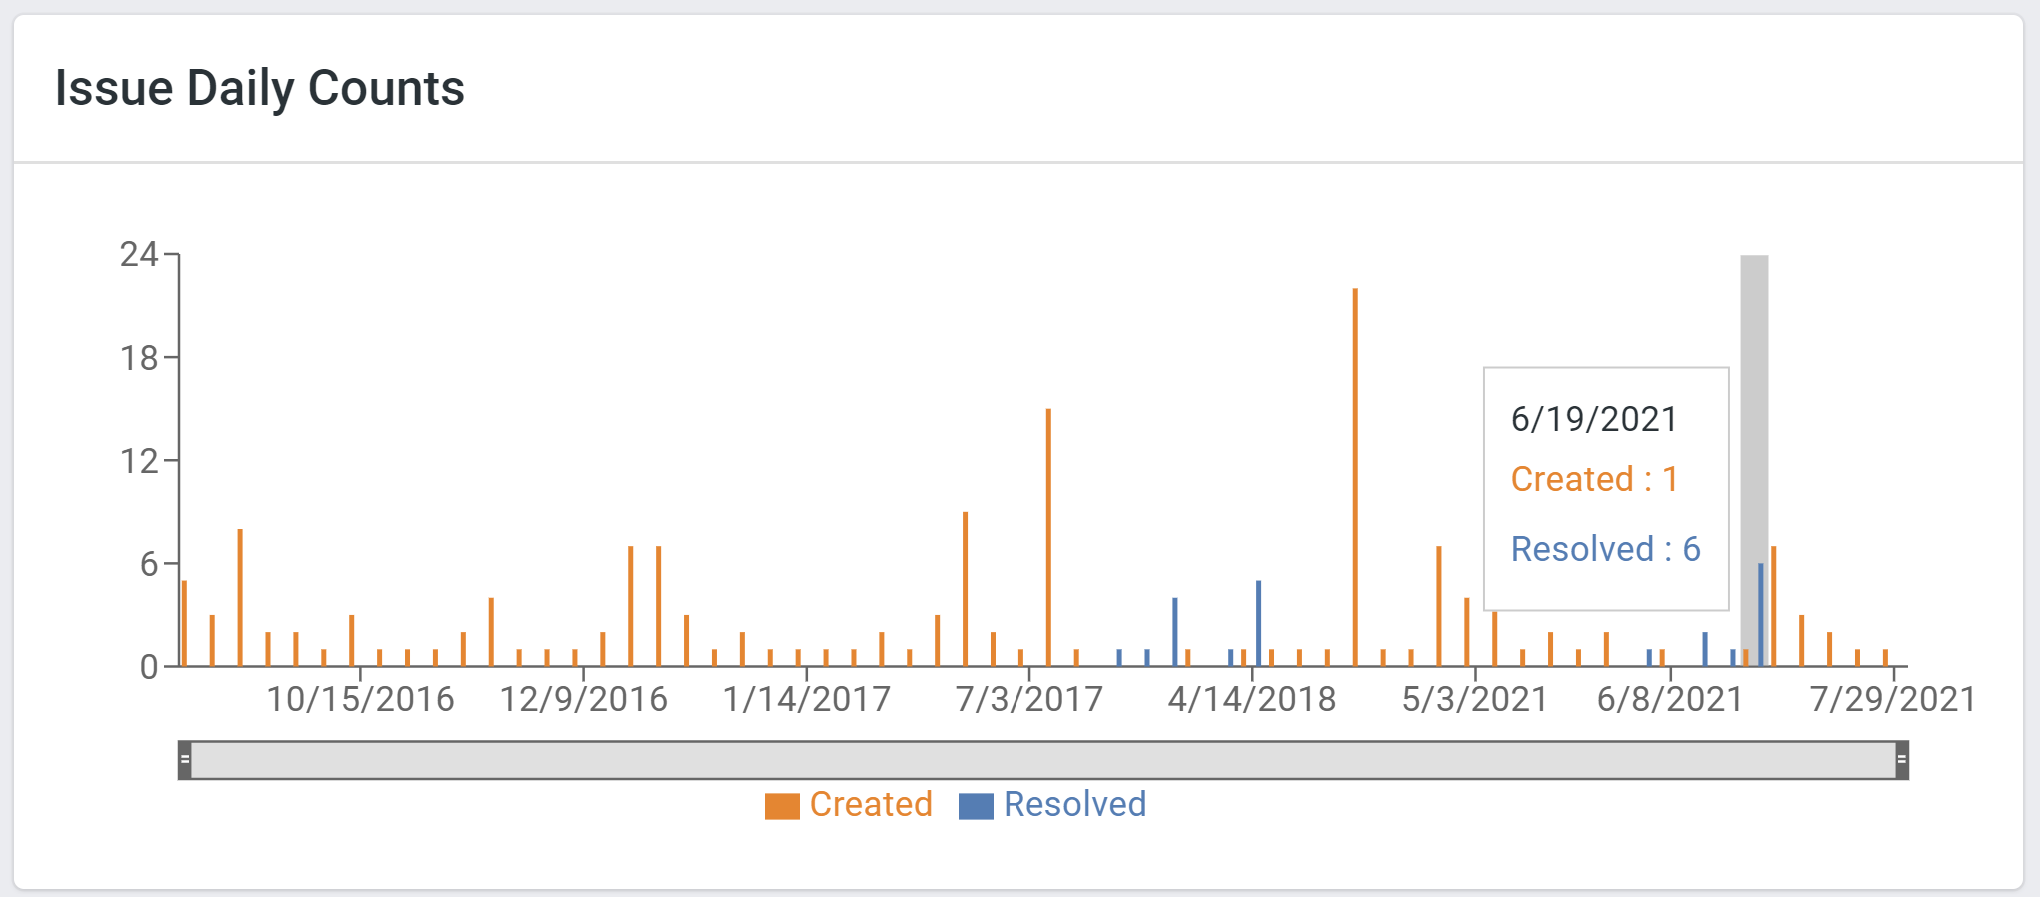
Issue Daily Counts
This is similar to the burnup chart but in a bar chart format.
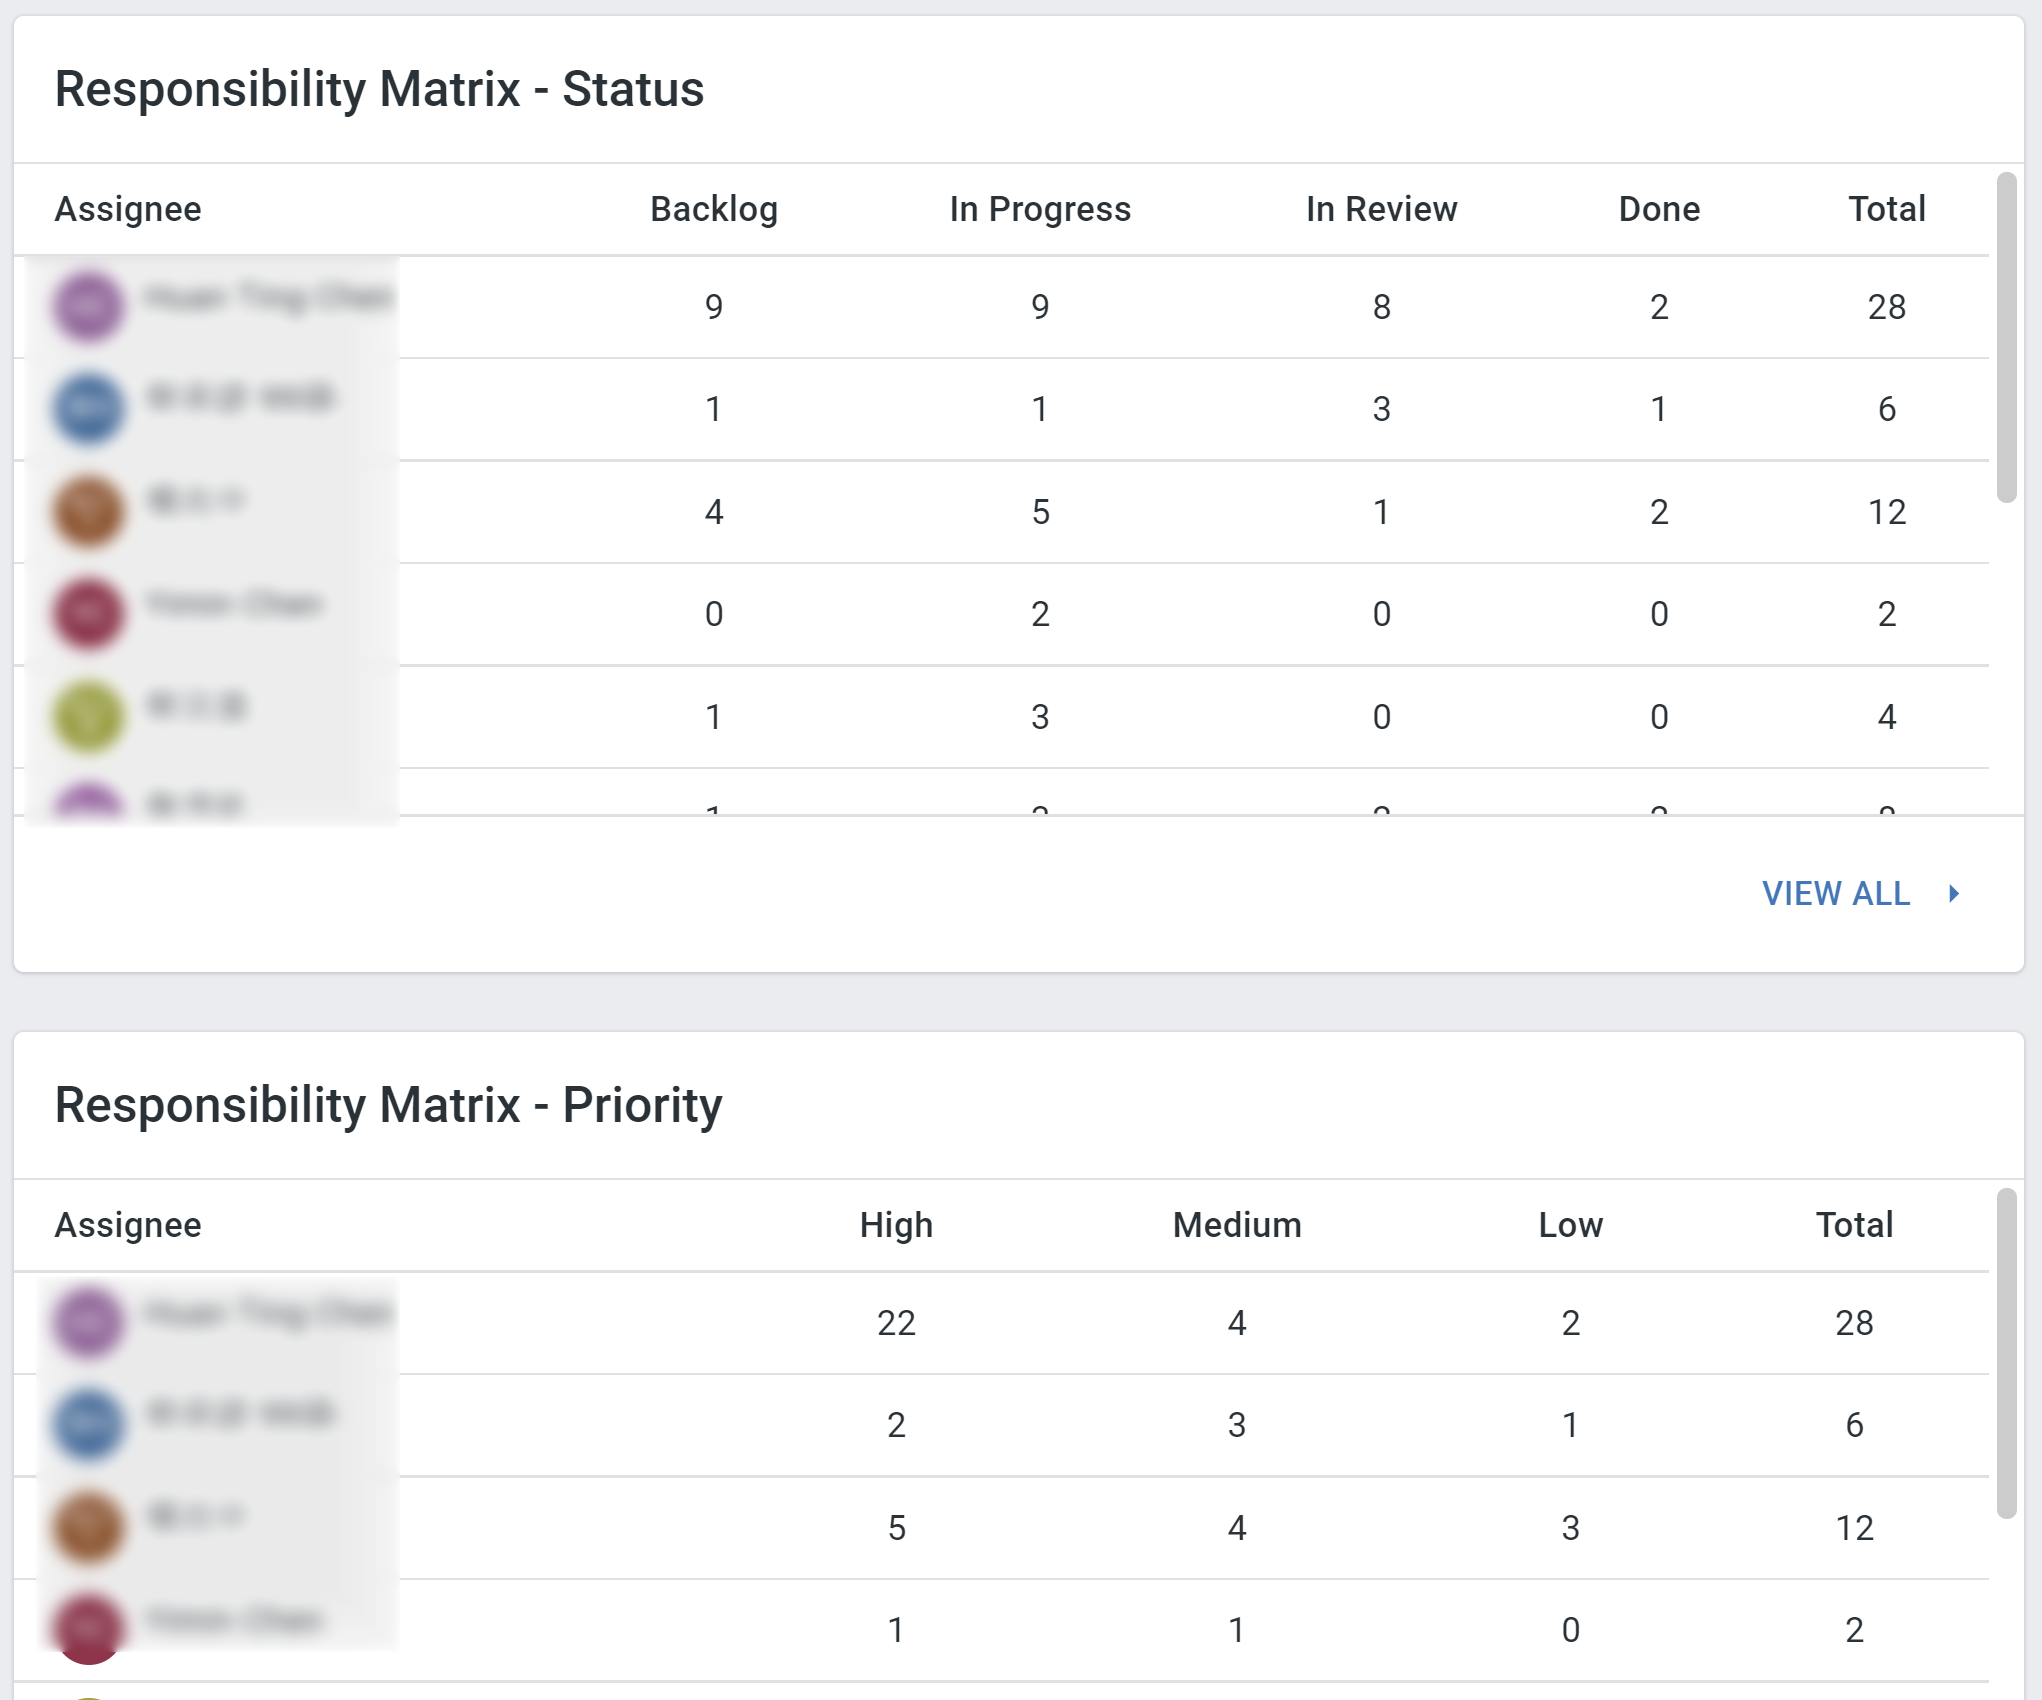
Responsibility Matrix
A responsibility matrix is a tool to monitor workload for every assignee as per status or priority.